

Where are the most affordable places to live in Australia?

Housing affordability has been on the decline in Australia for decades, thanks to the combination of a booming economy, growing population, and low interest rates.
Australia’s housing market has hit record highs year after year, with the average house price steadily trending upwards since the 1980s. However, property prices have really ramped up in recent years, with data from CoreLogic reporting a 21.6% rise between October 2020 and October 2021.
More importantly, this rise in property price is growing at twice the speed of wage growth. In the past two decades, average capital city dwelling prices surged by 200% compared to wages, which only rose 82%. The data from the past ten years tells a similar story, with property prices up 58% and wages up 26%.
With dwelling prices rising across the board, it can often feel like there’s nowhere left to get your foot in the door. However, according to ANZ and CoreLogic’s Housing Affordability Report, there are still pockets of affordable housing across the country — provided you know where to look and you’re ready to act fast.
How is housing affordability measured?

ANZ and Core Logic’s report measures housing affordability based on a number of metrics, including:
- the ratio of property values to household income over a set period of time
- the length of time it takes for a household to save enough for a 20% deposit
- mortgage serviceability, which is calculated as the portion of income a household requires to service a new mortgage
- the percentage of gross annual household income that’s required to pay rent
How has Australia’s housing affordability changed over time?

It’s no surprise that Australia’s housing affordability has declined significantly, particularly over the course of the past two decades. In fact, national housing affordability has worsened more in Australia than other comparable countries, such as the UK or the US.
So what’s behind this decline?
The numbers from ANZ and CoreLogic’s report reveal which factors are driving the increase at a national level.
Dwelling value to income ratio
In the June quarter of 2021, the national dwelling value to income ratio reached a record high of 7.7. This is a significant increase from the average dwelling value to income ratio for the decade, which was 6.3.
Part of the reason behind this is due to a sharp growth in demand for houses as more people work from home during COVID-19 — and in fact, the gap between the value to household income ratio for houses and units is at the widest it has ever been.

Years needed to save for a deposit
Saving enough for a deposit is the first step to buying a home. The report shows that if a household saved 15% of their gross annual income every year, it would take the average household just over a decade (10.2 years) to save enough for a property.

But there is some good news: at 22%, the household savings rate in the June 2020 quarter is significantly above the previous decade’s average of 6.7%, as spending behaviour changed during COVID-19 lockdowns.
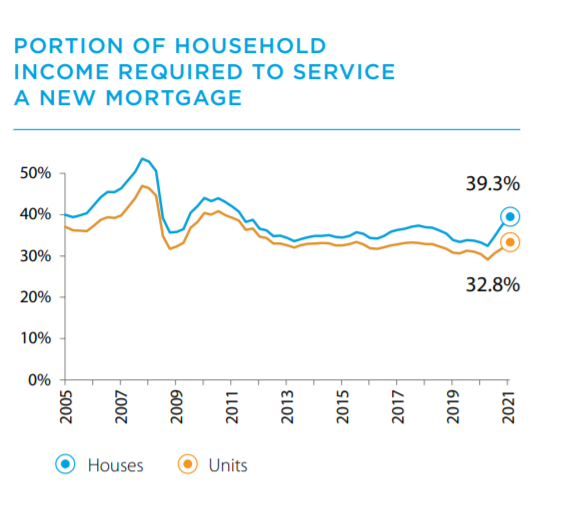
Mortgage serviceability
Despite it being more challenging to save up enough for a deposit, Australia’s mortgage serviceability has remained fairly stable over the last decade due to ongoing low interest rates. At the end of the June 2021 quarter, Australian households would need to put 37.2% of their household income to service a new mortgage, which is only a few percentage points above the decade’s average of 34.7%.
Portion of income required to pay rent
The portion of income required to pay rent was lower than the portion of income required to service a mortgage in the June 2021 quarter. However, at 29.4%, this is still the highest percentage on record.
What’s more, the report revealed that there is a distinct difference in the portion of income needed to rent a house versus the portion needed to rent a unit. House rents account for 30.5% of household income, while units account for just 27.1%.

Looking to buy a property? Seek a sharper interest rate with Rateseeker’s free online tool.
Where is the most affordable region to live in Australia?
Perhaps unsurprisingly, ANZ and CoreLogic’s report found that Sydney is Australia’s least affordable capital city to live in.
Based on the affordability measures, Sydney’s ratio of median property price to median income is 10.1, and it takes Sydneysiders an average of 13.5 years to save for a 20% deposit. Once households have purchased a home, roughly 49.1% of income goes to servicing the mortgage.
On the flipside, households in Darwin have an average value-to-income ratio of 4.8 and can save for a deposit in just 6.4 years on average. Mortgage serviceability is also the lowest of all the capital cities, with just 23.4% of income going to service the mortgage.
| City | Value to income ratio | Years to save a 20% deposit | % of income to service a new mortgage | Proportion of income to pay rent |
| Sydney | 10.1 | 13.5 | 49.1% | 30.8% |
| Melbourne | 8.5 | 11.3 | 41.2% | 26.1% |
| Brisbane | 6.6 | 8.8 | 32.0% | 27.9% |
| Adelaide | 6.9 | 9.3 | 33.7% | 30.5% |
| Perth | 6.0 | 8.0 | 29.0% | 28.0% |
| Hobart | 8.0 | 10.6 | 38.6% | 33.9% |
| Darwin | 4.8 | 6.4 | 23.4% | 28.9% |
| ACT | 6.6 | 8.8 | 32.0% | 27.7% |
What are the most affordable suburbs in Sydney?
With a value to income ratio of 6.9 and just 9.2 years needed to save for a deposit, Parramatta is Sydney’s most affordable suburb. Households in Parramatta only need to put 33.4% of their income towards servicing their mortgage, compared to the city’s average of 49.1%.
Meanwhile, Pittwater had the least affordable housing in the city with a value-to-income ratio of 21.4 and a whopping 28.5 years needed to save for a mortgage. Here’s the kicker: with mortgage serviceability of 103.7%, you’d need to find other avenues for income to pay the debt off over time.
| Suburb | Value-to-income ratio | Years to save a deposit | Portion of income to service a new mortgage | Portion of income to pay rent |
| Parramatta | 6.9 | 9.2 | 33.4% | 23.9% |
| Penrith | 8.0 | 10.6 | 38.6% | 26.3% |
| Camden | 8.1 | 10.9 | 39.5% | 27.0% |
| Wollondilly | 8.2 | 11.0 | 40.0% | 27.5% |
| Blacktown – North | 8.3 | 11.1 | 40.3% | 26.1% |
What are the most affordable suburbs in Melbourne?
Located 50km west of the CBD, Melton–Bacchus Marsh is the most affordable suburb in the greater Melbourne area. The value-to-income ratio is 6.6 and it takes households an average of 8.7 years to save 20% deposit — far less than the city’s average of 11.3 years. Mortgage serviceability is also fair with households needing to put roughly a third (31.8%) of their income towards paying off their loan.
Conversely, Melbourne’s Manningham-West is the city’s least affordable suburb with an average dwelling value-to-income ratio of 15.6. Buyers would need to save for 20.8 years to have enough for a 20% deposit, and put 75.5% of their income into servicing their mortgage.
| Suburb | Value-to-income ratio | Years to save a deposit | Portion of income to service a new mortgage | Portion of income to pay rent |
| Melton–Bacchus Marsh | 6.6 | 8.7 | 31.8% | 23.8% |
| Stonnington-West | 6.6 | 8.8 | 32.0% | 23.0% |
| Wyndham | 6.8 | 9.1 | 33.0% | 22.7% |
| Port Phillip | 6.9 | 9.2 | 33.5% | 23.9% |
| Yarra | 7.3 | 9.8 | 35.6% | 24.6% |
What are the most affordable suburbs in Brisbane?
Brisbane is one of the more affordable capital cities in the country — and within the city, Springfield–Redbank is by far the most inexpensive suburb. The value-to-income ratio for Springfield–Redbank is 4.7, it takes just 6.2 years to save a deposit for a property, and mortgage serviceability is a respectable 22.6%.
On the opposite side of the spectrum, Bribie-Beachmere is Brisbane’s least affordable suburb with a dwelling value-to-income ratio of 10.4. Borrowers would need to save for 13.9 years to have enough for a deposit and dedicate 50.7% of their income to servicing their new mortgage.
| Places | Value-to-income ratio | Years to save a deposit | Portion of income to service a new mortgage | Portion of income to pay rent |
| Springfield–Redbank | 4.7 | 6.2 | 22.6% | 23.9% |
| Ipswich Inner | 4.8 | 6.4 | 23.1% | 24.9% |
| Loganlea–Carbrook | 5.5 | 7.4 | 26.7% | 27.4% |
| Springwood–Kingston | 5.3 | 7.1 | 25.8% | 28.6% |
| Browns Plains | 5.3 | 7.1 | 25.7% | 27.2% |
What are the most affordable suburbs in Adelaide?
Adelaide’s Playford suburb offers up the city’s most affordable housing, with a value-to-income ratio of 4.6. On average, households only need to save for 6.1 years in order to have enough for a deposit, while 22.2% of income would go towards servicing the mortgage.
Burnside is the least affordable area in Adelaide: it takes 15.6 years to save a 20% deposit for a home in this suburb, and the average value-to-income ratio is 11.7. Mortgage serviceability is also challenging, with 56.7% of income going towards servicing the loan.
| Place | Value-to-income ratio | Years to save a deposit | Portion of income to service a new mortgage | Portion of income to pay rent |
| Playford | 4.6 | 6.1 | 22.2% | 27.6% |
| Gawler–Two Wells | 5.6 | 7.5 | 27.2% | 28.0% |
| Salisbury | 5.7 | 7.7 | 27.9% | 30.5% |
| Tea Tree Gully | 6.4 | 8.6 | 31.2% | 29.2% |
| Adelaide Hills | 6.8 | 9.0 | 32.9% | 29.8% |
What are the most affordable suburbs in Perth?
Perched just above Rockingham, Kwinana is the most affordable suburb in Western Australia’s capital with a property value-to-income ratio of 4.4. Households need less than 6 years to save a 20% deposit for a home in the area, and mortgage serviceability sits at 21.4% — just over a fifth of the total household income.
Buyers in Cottesloe-Claremont have to face a different situation entirely. Thanks to its stunning beach and proximity to the CBD, the dwelling value-to-income ratio in Cottesloe-Claremont is 13.6 — well above Perth’s average. It takes an average of 18.1 years to save for a property in this suburb and, once purchased, homeowners need to dedicate 65.8% of their income to servicing their new mortgage.
| Places | Value-to-income ratio | Years to save a deposit | Portion of income to service a new mortgage | Portion of income to pay rent |
| Kwinana | 4.4 | 5.9 | 21.4% | 26.8% |
| Serpentine–Jarrahdale | 4.8 | 6.4 | 23.3% | 24.6% |
| Armadale | 5.0 | 6.7 | 24.3% | 27.3% |
| Gosnells | 5.2 | 6.9 | 25.2% | 27.9% |
| Rockingham | 5.3 | 7.0 | 25.5% | 28.4% |
What are the most affordable suburbs in Hobart?
Hobart’s property prices have spiked in recent years, but the suburb of Brighton is still fairly affordable for aspiring homeowners. The value-to-income ratio in Brighton is 6.5 and it takes 8.6 years to save for a deposit — and homeowners only need to put aside roughly a third of their income (31.3%) to service their new loan.
Unsurprisingly, Hobart Inner was the least affordable with a 9.8 value-to-income ratio. It takes 13.1 years to save a 20% deposit for a home in this area, and 47.7% of income goes towards servicing a new mortgage.
| Area | Value-to-income ratio | Years to save a deposit | Portion of income to service a new mortgage | Portion of income to pay rent |
| Brighton | 6.5 | 8.6 | 31.3% | 33.1% |
| Sorrel–Dodges Ferry | 7.5 | 10.0 | 36.4% | 33.7% |
| Hobart North West | 7.6 | 10.1 | 36.8% | 38.0% |
| Hobart – South and West | 8.3 | 11.1 | 40.5% | 33.4% |
| Hobart Inner | 9.8 | 13.1 | 47.7% | 36.0% |
What are the most affordable suburbs in Darwin?
It takes just 6.1 years to save for a deposit in Palmerston, and the average dwelling value is only 4.5 times greater than the average household income. What’s more, households only need to put 22.0% of their income towards servicing their new mortgage in Palmerston. However, housing affordability is fairly good across the board: even Darwin City is fairly inexpensive to buy, with a value-to-income ratio of 4.6.
| Region | Value-to-income ratio | Years to save a deposit | Portion of income to service a new mortgage | Portion of income to pay rent |
| Palmerston | 4.5 | 6.1 | 22.0% | 27.8% |
| Darwin City | 4.6 | 6.1 | 22.2% | 29.7% |
| Darwin Suburbs | 5.1 | 6.8 | 24.7% | 29.1% |
| Litchfield | 5.8 | 7.7 | 27.9% | 31.6% |
What are the most affordable suburbs in Canberra?
Canberra is home to one of the most affordable suburbs of any capital city: Molonglo. In Molonglo, the value-to-income ratio is just 2.5 and it takes only 3.3 years to save for a deposit. Once you’ve locked in a place, mortgage serviceability is also incredibly low at just 12.0%.
However, if you’re looking to buy in Woden Valley, it’s a very different story. In this suburb, it takes borrowers 11.9 years on average to save a 20% deposit and the value-to-income ratio is 8.9. The portion of income required to service a mortgage is also fairly high at 43.2%.
| Suburb | Value-to-income ratio | Years to save a deposit | Portion of income to service a new mortgage | Portion of income to pay rent |
| Molonglo | 2.5 | 3.3 | 12.0% | 12.5% |
| South Canberra | 6.0 | 8.0 | 29.2% | 26.3% |
| Tuggeranong | 6.6 | 8.7 | 31.8% | 29.2% |
| Gungahlin | 6.7 | 8.9 | 32.5% | 27.1% |
| Belconnen | 6.9 | 9.2 | 33.3% | 29.3% |
Buy your dream home sooner with Rateseeker
With housing affordability on the decline, securing the sharpest rate on your home loan is more important now than ever. The team at Rateseeker has access to more than 30+ of Australia’s leading lenders, which allows us to unlock the best rates on the market for your personal and financial situation. Contact us now for an obligation-free consultation.
** General Advice Warning
The information provided on this website is general in nature only and it does not take into account your personal needs or circumstances into consideration. Before acting on any advice, you should consider whether the information is appropriate to your needs and where appropriate, seek professional advice in relation to legal, financial, taxation, mortgage or other advice.


